The Noisy Neighbor Scenario
In shared hypervisor environments, neighbor VM activity can cripple your application’s stability. Cloud Insights identifies the precise resource contention path and reveals the real driver behind symptoms.
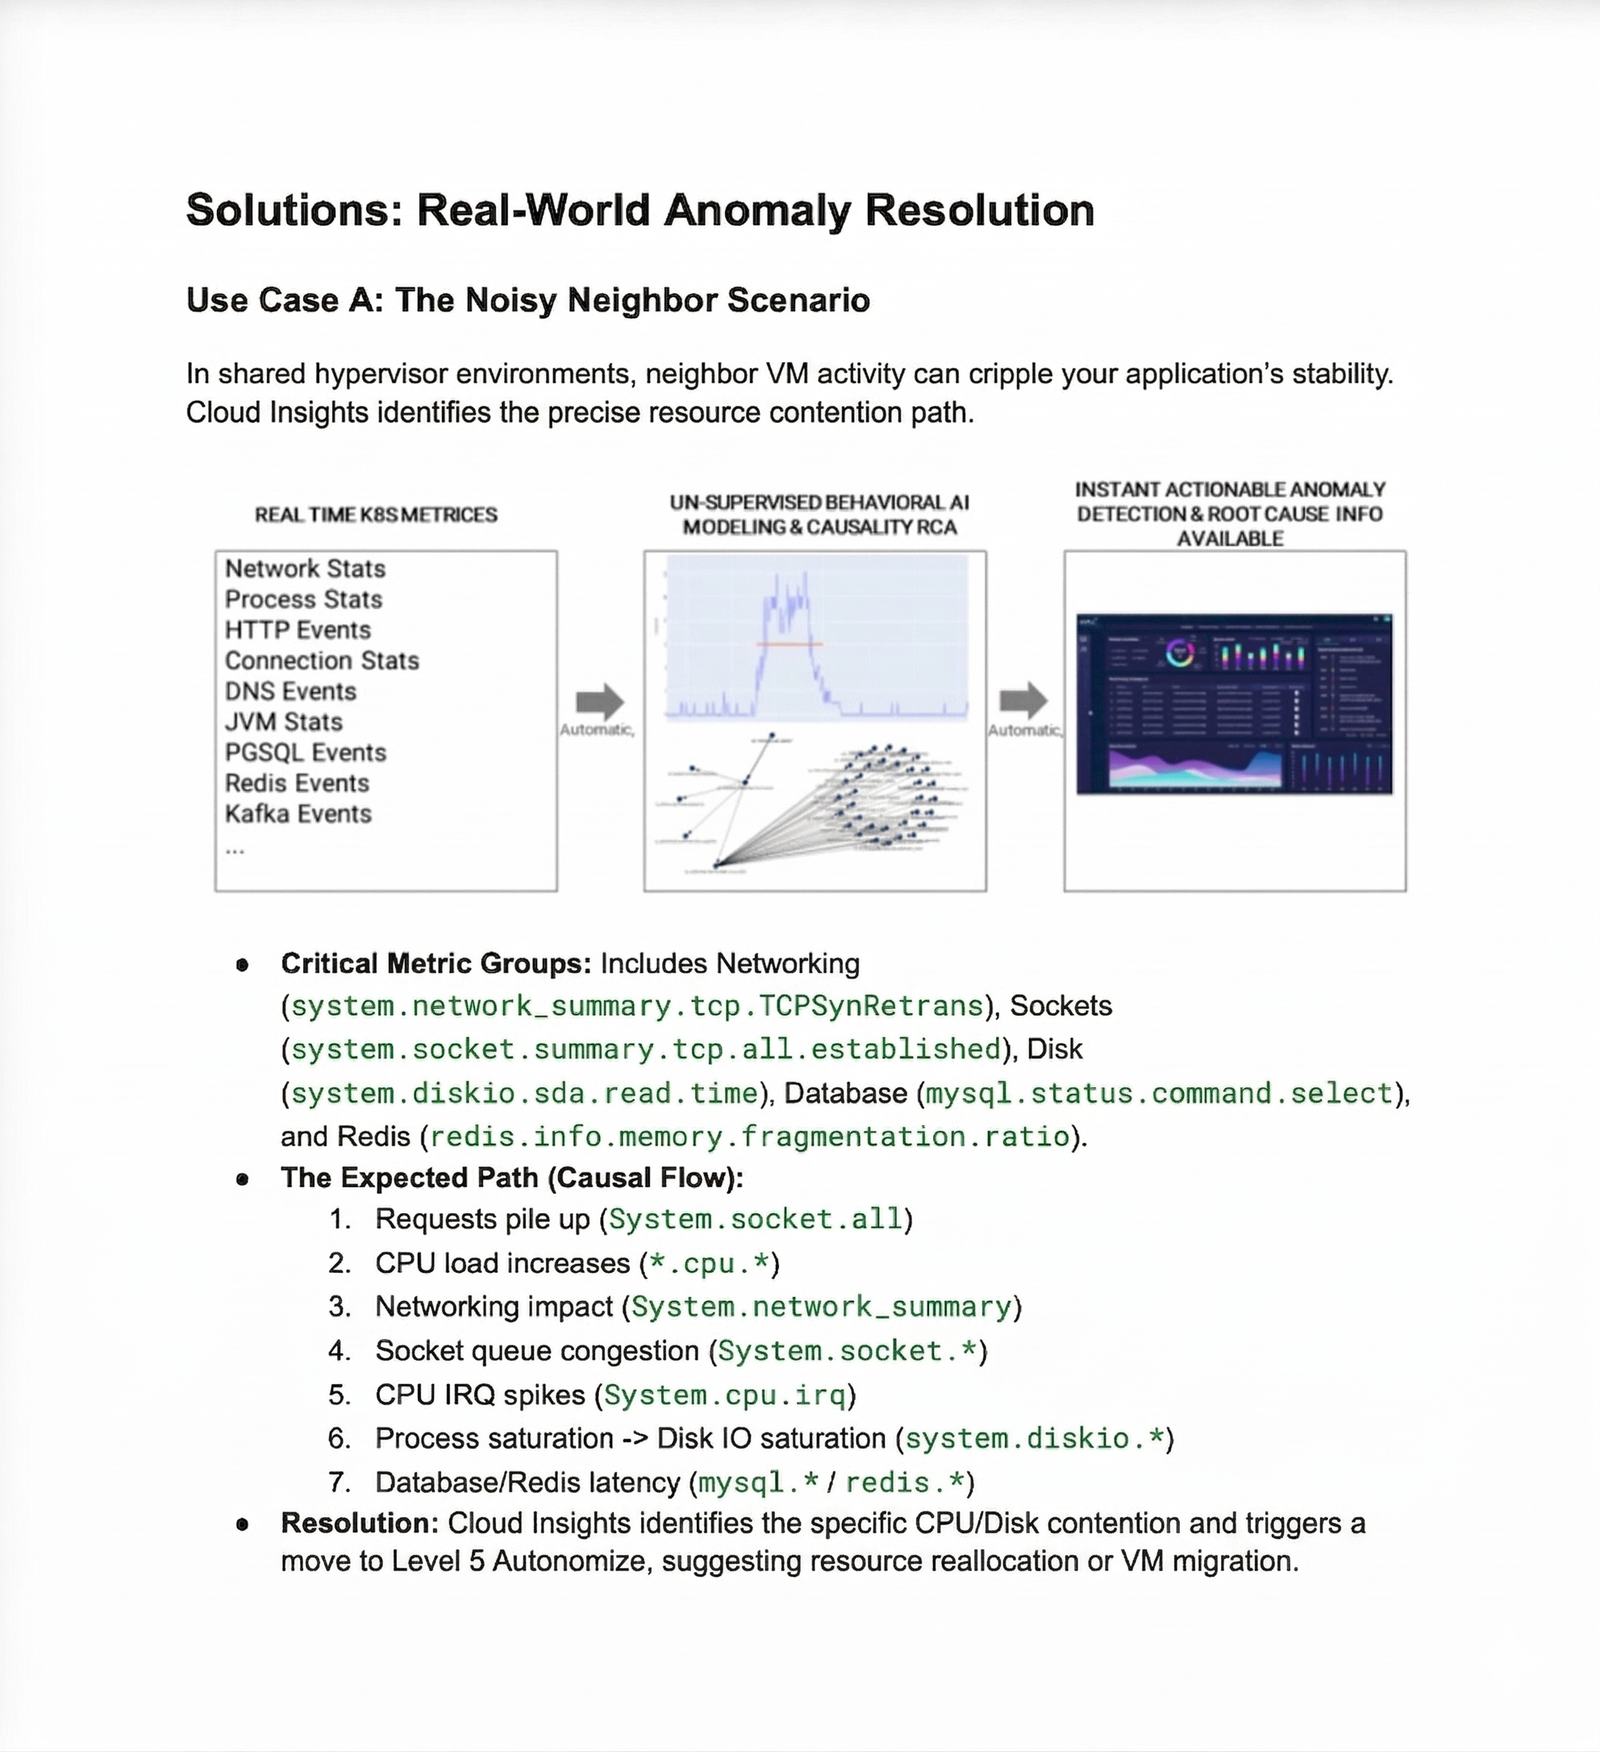
Critical Metric Groups
- Networking: system.network_summary.tcp.TCPSynRetrans
- Sockets: system.socket.summary.tcp.all.established
- Disk: system.diskio.sda.read.time
- Database: mysql.status.command.select
- Redis: redis.info.memory.fragmentation.ratio
Resolution
Cloud Insights identifies the specific CPU and disk contention and triggers movement toward Level 5 Autonomize, suggesting resource reallocation or VM migration to remove the performance bottleneck.
Expected Path — Causal Flow
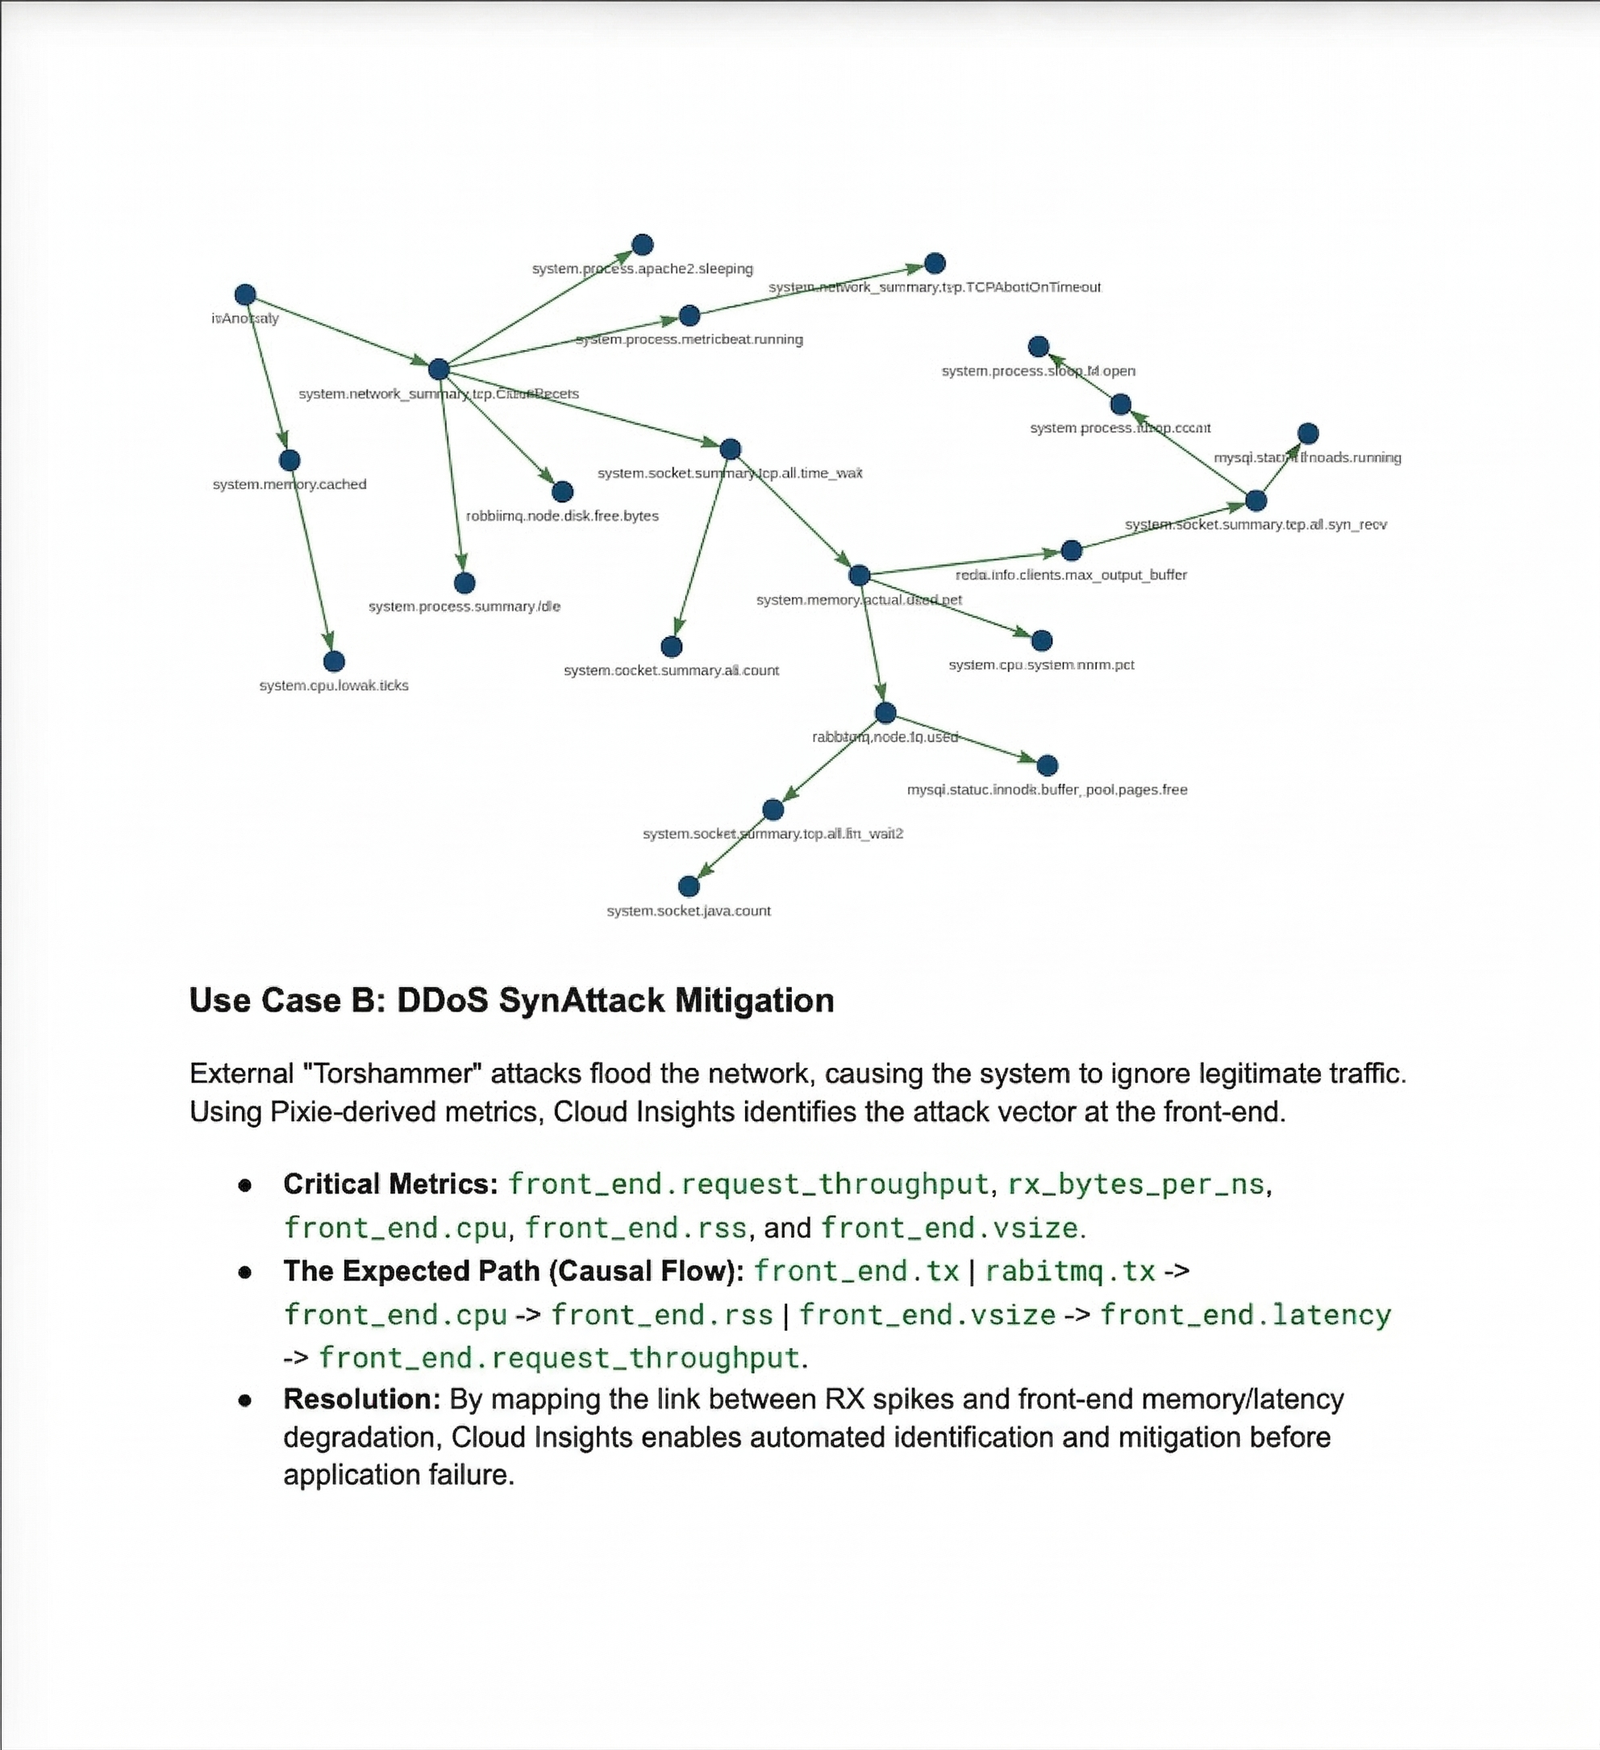
DDoS SynAttack Mitigation
External Torshammer-style attacks flood the network, causing the system to ignore legitimate traffic. Using Pixie-derived metrics, Cloud Insights identifies the attack vector at the front-end layer.
Critical Metrics
- front_end.request_throughput
- rx_bytes_per_ns
- front_end.cpu
- front_end.rss
- front_end.vsize
Expected Path
Resolution
By mapping the relationship between RX spikes, memory pressure, latency degradation, and application throughput, Cloud Insights enables automated identification and mitigation before application failure or service disruption.
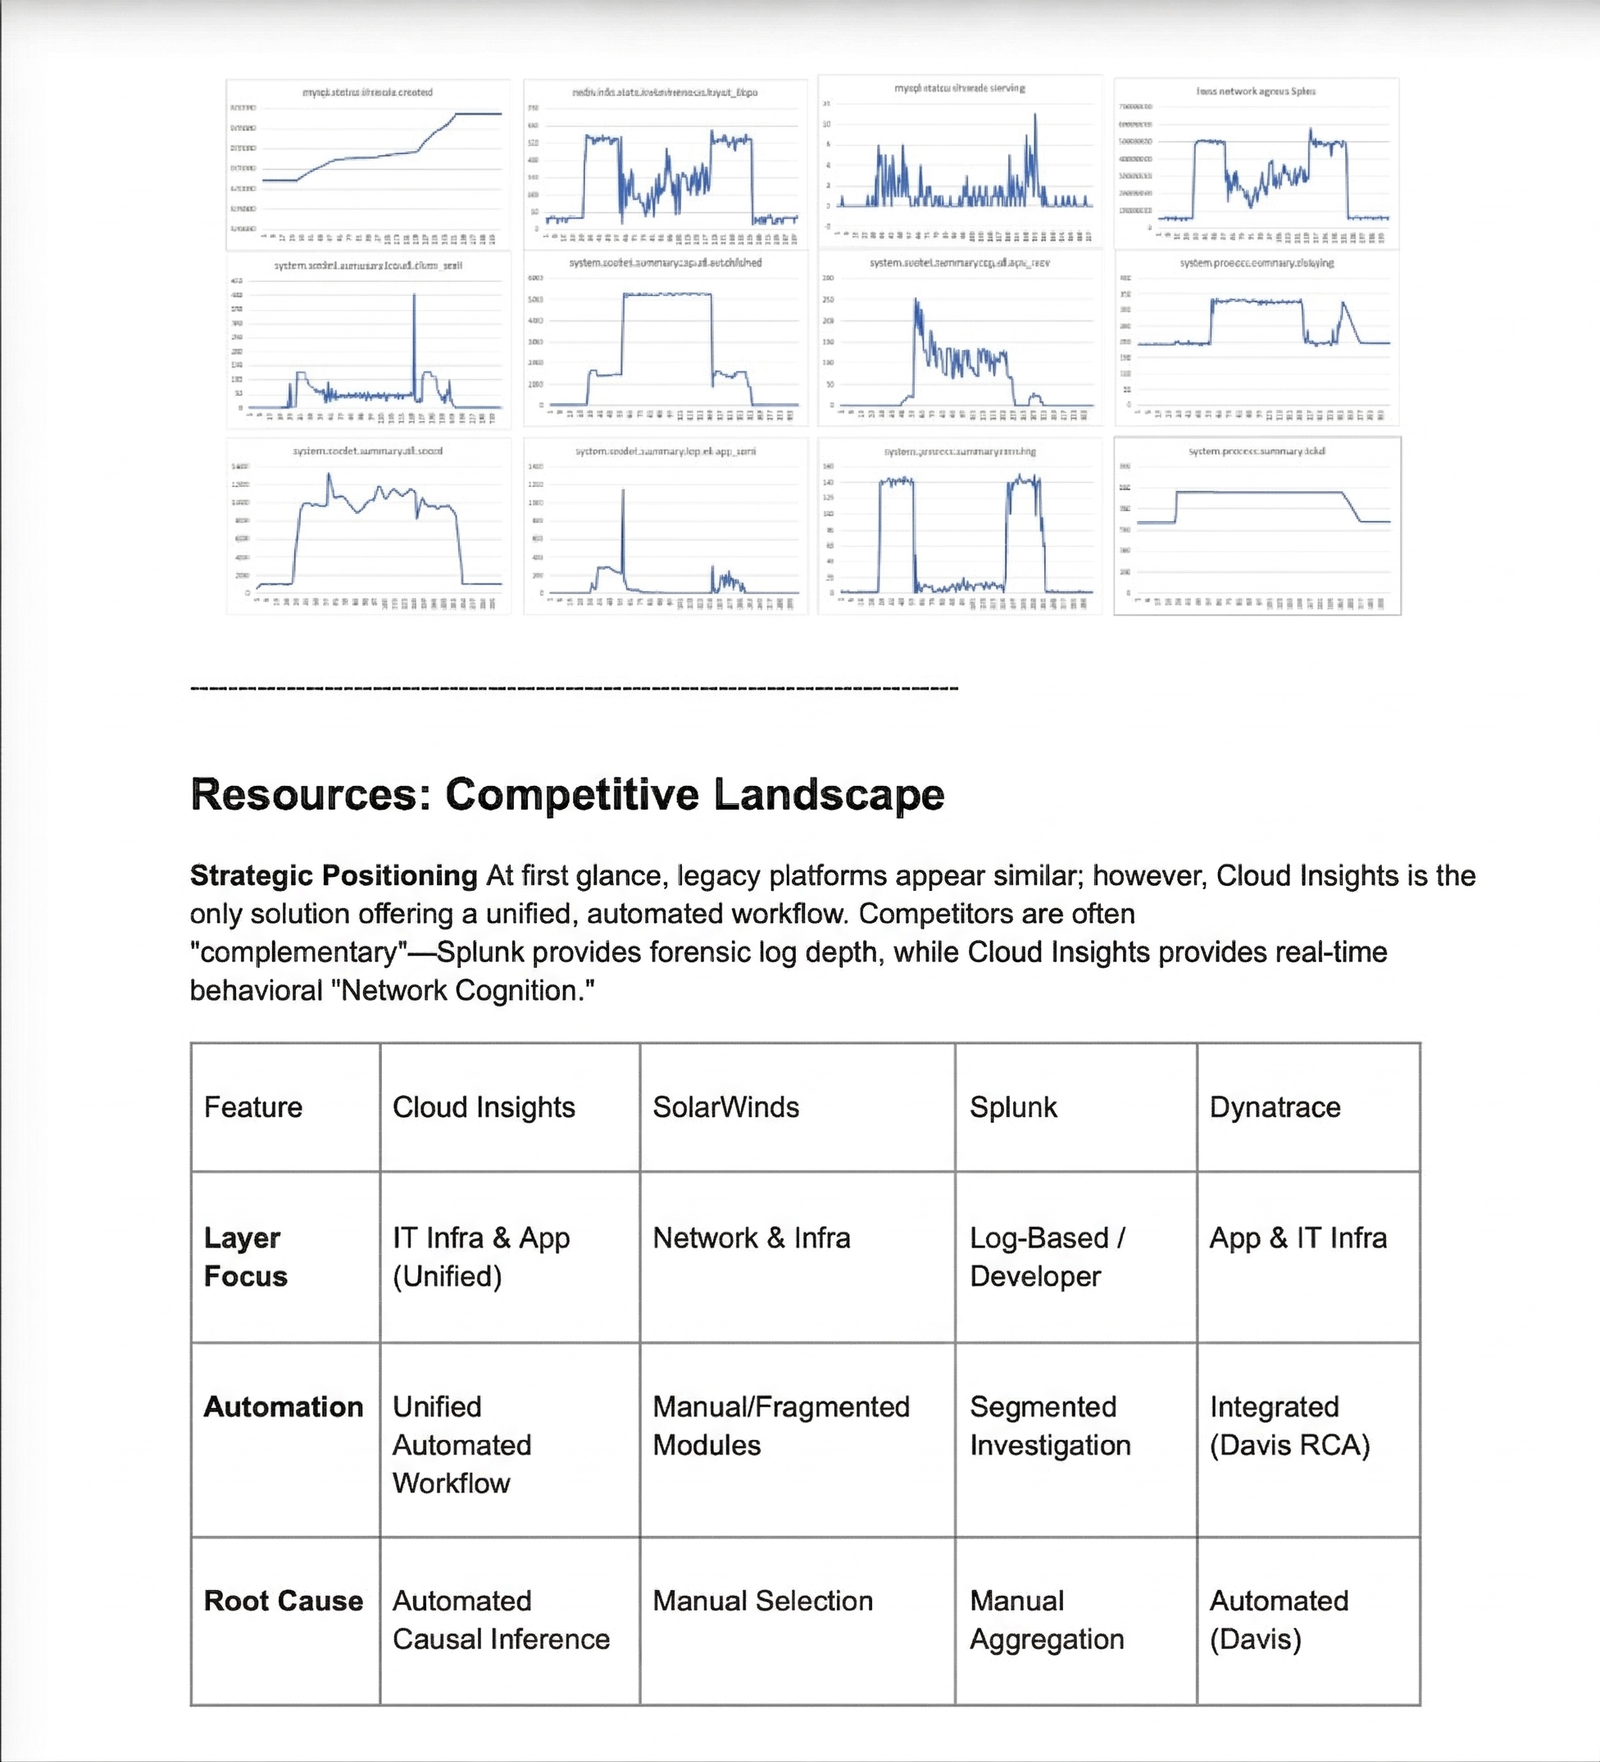
Want to compare Cloud Insights with legacy observability platforms?
Continue to the competitive landscape and see how Cloud Insights differs from traditional tools.